
Geographic access: How cities use mapping to drive fairer decisions
This blog was written by Rebecca Wessinghage and edited by Matteo Bizzotto, ICLEI World Secretariat.
Where people live often determines the opportunities and risks they face. Whether in coastal communities threatened by surging storms, or urban neighborhoods impacted by decades of unequal investment, geography plays a powerful role in shaping everyday life. Yet these patterns are rarely random. They are often the result of economic pressures, planning decisions, environmental conditions, and historical policies that continue to influence outcomes today.
In Del Carmen, Philippines, for example, climate vulnerability is closely tied to place. Small island communities here face geographic isolation that cuts them off from food, healthcare, education, and social services, while storms, flooding, and rising seas pose constant threats. For households relying on small-scale fisheries and marine resources for income, moving to safety is financially impossible. They remain disproportionately exposed to climate risks shaped by circumstances beyond their control. In response, local authorities have used spatial and environmental data to identify vulnerable coastal barangays, the smallest territorial and administrative units in the Philippines. The resulting insights have helped to guide climate adaptation measures, support disaster risk reduction, and inform tourism and coastal resource management. Building on these insights, government land acquisition offers one pathway to directly support the most exposed communities by securing safer inland locations and providing relocation opportunities at affordable prices – particularly as land value continues to rise.
Similar dynamics appear in cities around the world. When we look at maps of housing quality, air pollution, heat exposure, access to green space, public transport, healthcare, or fresh food access, familiar patterns often emerge. The same neighborhoods repeatedly face multiple disadvantages, while others consistently benefit from better services, infrastructure, and environmental conditions. Research on inequalities in cities has shown that multiple forms of inequality intersect with one another, with lower income communities often facing a greater concentration of environmental burdens and fewer environmental benefits.
While geography reveals how inequality is experienced in daily life, affordability often determines who is exposed to it. Access to safer, healthier, and better connected neighborhoods is frequently shaped by what people can afford, meaning that lower income households are more likely to live in areas where environmental, social, and economic disadvantages overlap.
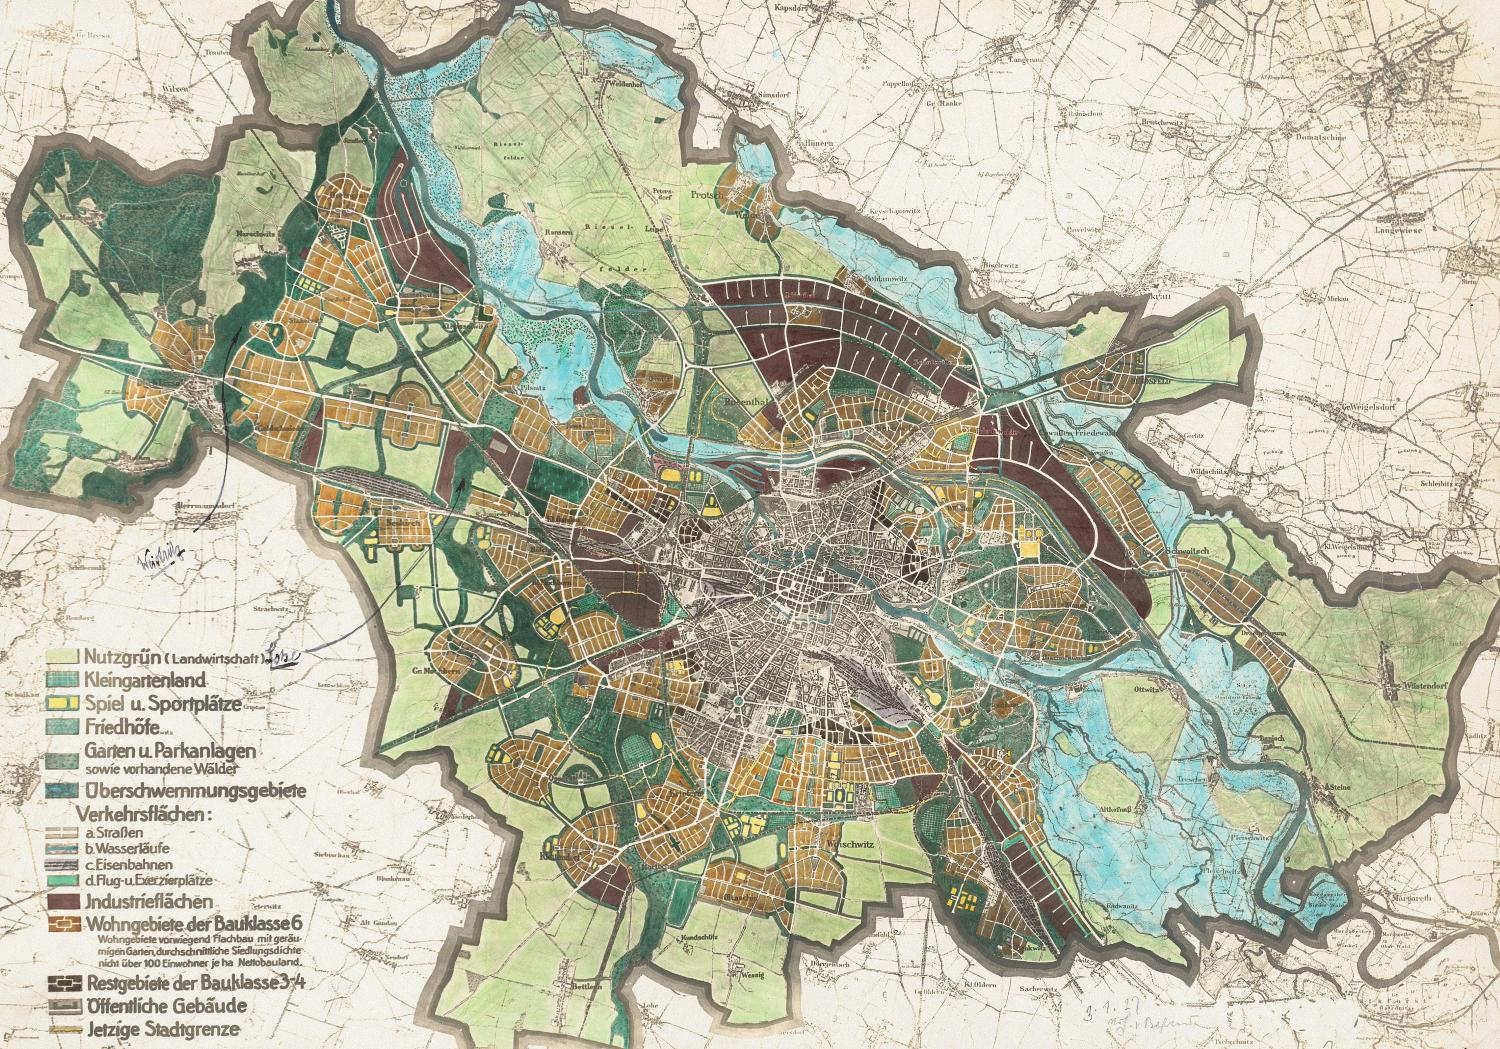
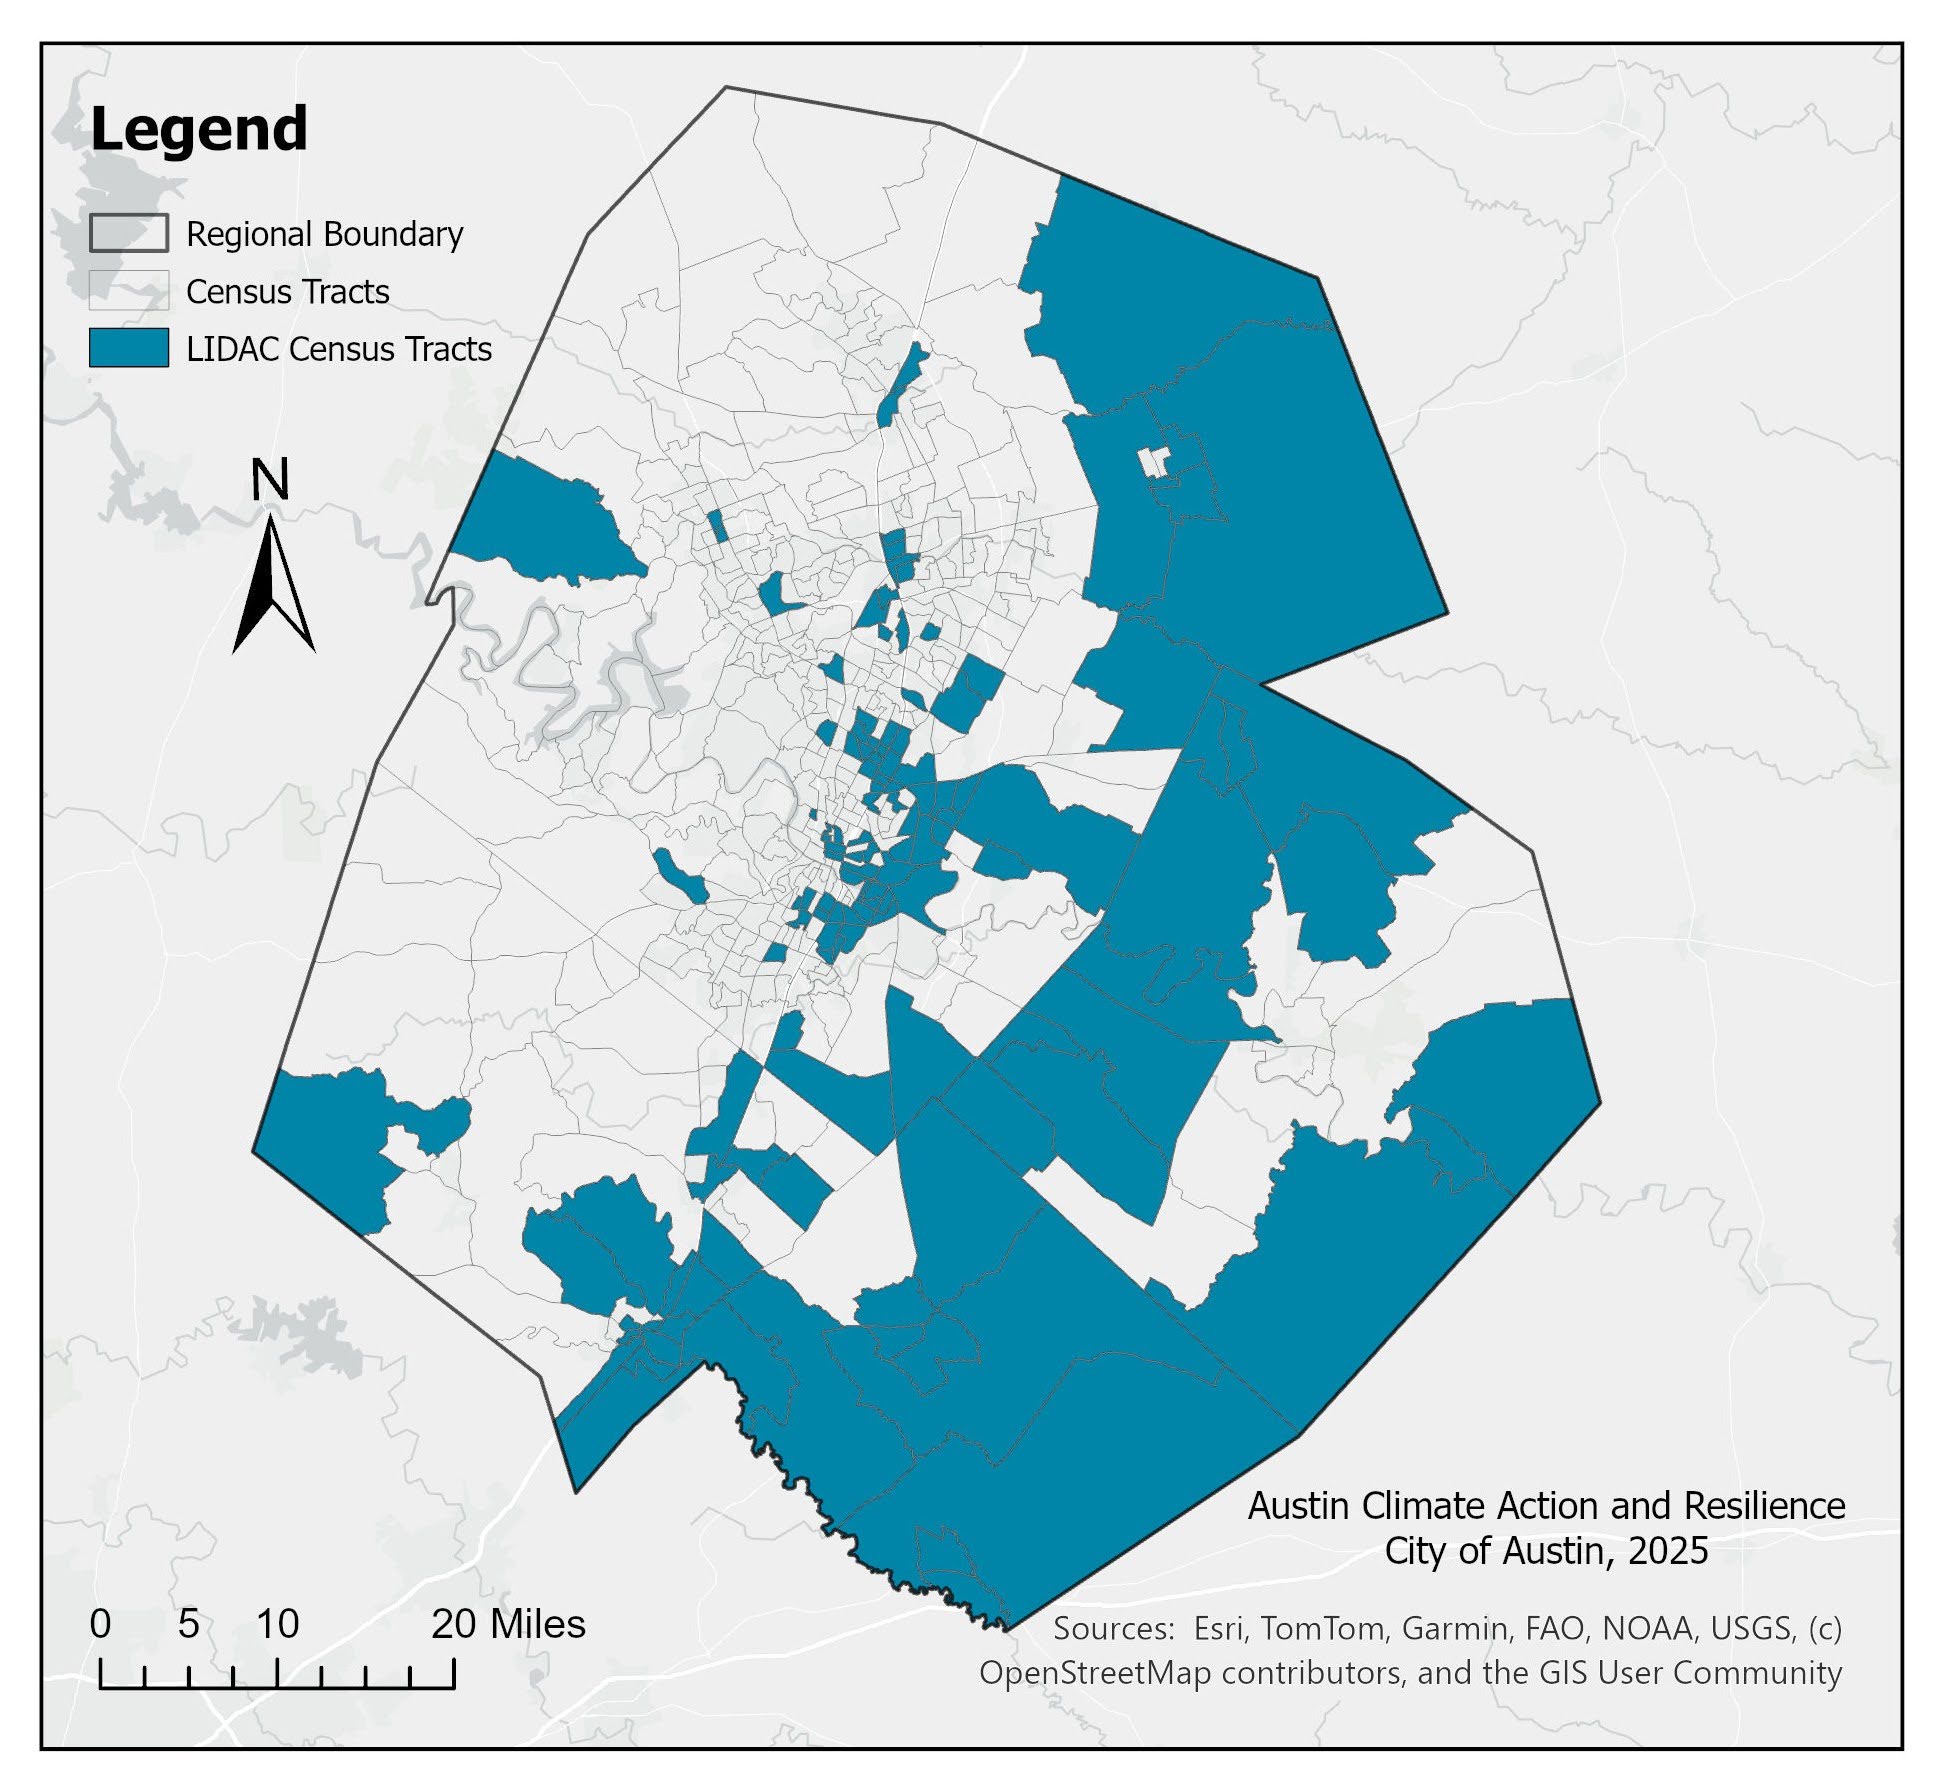
Across cities in the U.S., planning policies have reinforced these patterns over time. In Austin, Texas, the legacy of redlining, a practice that divided communities along racial lines, continues to shape people’s lives nearly a century after the city’s 1928 Master Plan. Race remains one of the strongest predictors of inequality also when looking at climate impacts. Historically disadvantaged communities remain concentrated in low lying and flood prone areas. The Austin-Round Rock-Georgetown Comprehensive Climate Action Plan explicitly recognizes the need to direct climate and sustainability investments toward neighborhoods that have experienced historical exclusion and disinvestment, acknowledging that communities of color continue to bear a disproportionate share of climate risks. Each strategy in the plan includes an assessment of impacts to low-income and disadvantaged communities.
Cities participating in the Malmö Commitment on Inclusive and Equitable Communities are increasingly using data to make these patterns visible and ensure that policies respond to them. The availability of reliable local data plays a crucial role in this work. In Santa Fé, Argentina, the annual Santa Fé, Cómo Vamos report has tracked more than 100 indicators for over a decade, using district-level data to reveal geographic disparities across the city. While cities use maps in different ways, a common goal emerges: Turning complex data into actionable knowledge.
Using maps to guide internal decisions
Mapping also serves as a practical tool for understanding inequalities and informing place-based decisions.
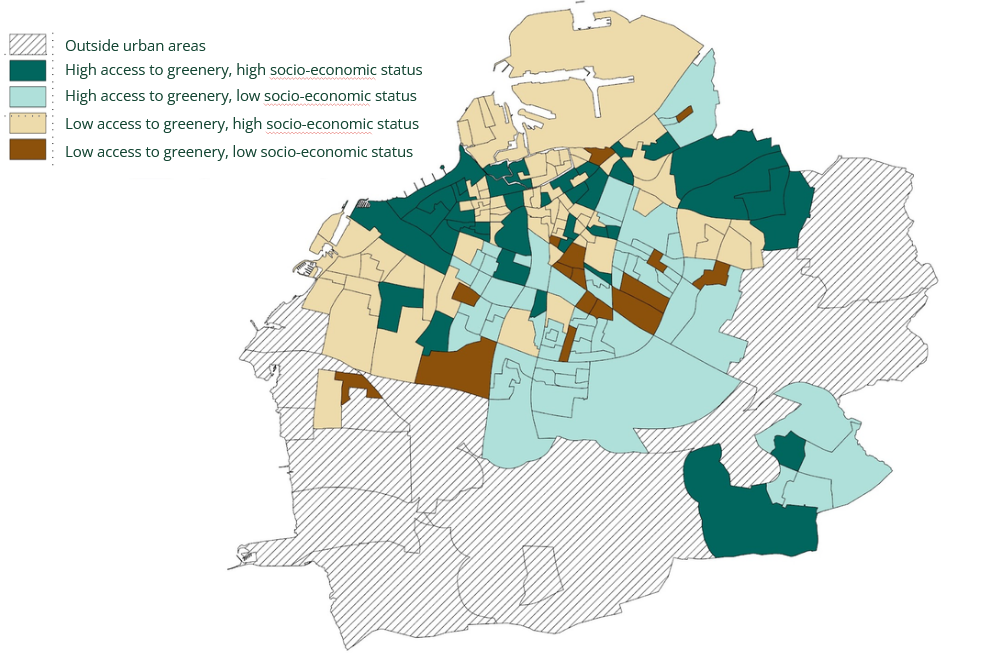
In Malmö, Sweden, repeated mapping exercises reveal that the eastern and central neighborhoods consistently experience lower economic standards, higher unemployment, weaker educational outcomes, and greater social vulnerability. Looking across multiple datasets allows city officials to identify where challenges overlap and where targeted interventions may have the greatest impact. The maps also reveal important nuances. Green space is relatively accessible throughout the city, yet inequalities persist in access to public transport, cycling infrastructure, and child-friendly public spaces, particularly in areas with a higher concentration of lower-income households. Carbon emissions tell a different story altogether, with wealthier western districts generating higher emissions despite facing fewer social challenges.
Pittsburgh, USA, uses a similarly layered approach, shaped by its distinctive geography and industrial history. The city’s steep hills, former industrial sites, transportation networks, and uneven environmental conditions all influence access to opportunities and services. To better understand these relationships, city departments combine data on tree canopy coverage, food access, traffic patterns, sidewalk conditions, pollution exposure, and flood risks. Mapping helps to identify priority areas for investment while supporting coordination across departments. It also highlights how economic and environmental burdens continue to disproportionately affect Black and lower income communities through unequal access to jobs, public transport, and healthy living environments.
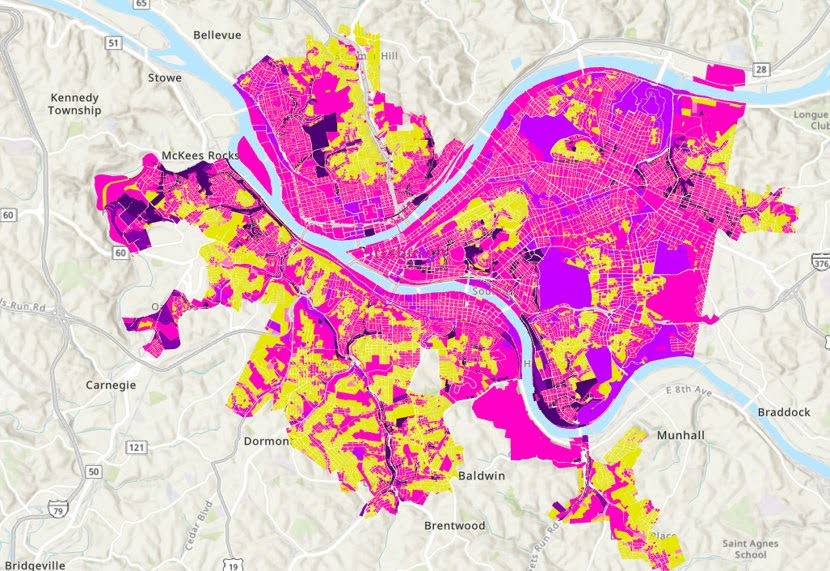
By revealing where different forms of disadvantage intersect, cities can allocate resources more effectively and design interventions that respond to real conditions on the ground.
Using maps to explain and justify investment decisions
In Newcastle, Australia, mapping provides the evidence needed to support strategic investment decisions and communicate priorities to decision makers and residents.
The city’s Blue Green Grid initiative will map waterways, green spaces, biodiversity, recreation opportunities, and socioeconomic conditions to understand how environmental and social challenges overlap. For many residents, public green spaces, natural reserves, waterways and shared paths provide important opportunities for physical activity, social connection and access to nature close to home. This is particularly important for residents living in higher-density housing, households with limited private open space, older people, young people and those experiencing barriers to participation.
The analysis shows that some communities have less access to nature while simultaneously experiencing higher exposure to Urban Heat Island (UHI) effect. Using sieve mapping techniques, Newcastle identifies locations where investment can deliver multiple benefits, including biodiversity protection, urban cooling, recreation and public health outcomes.
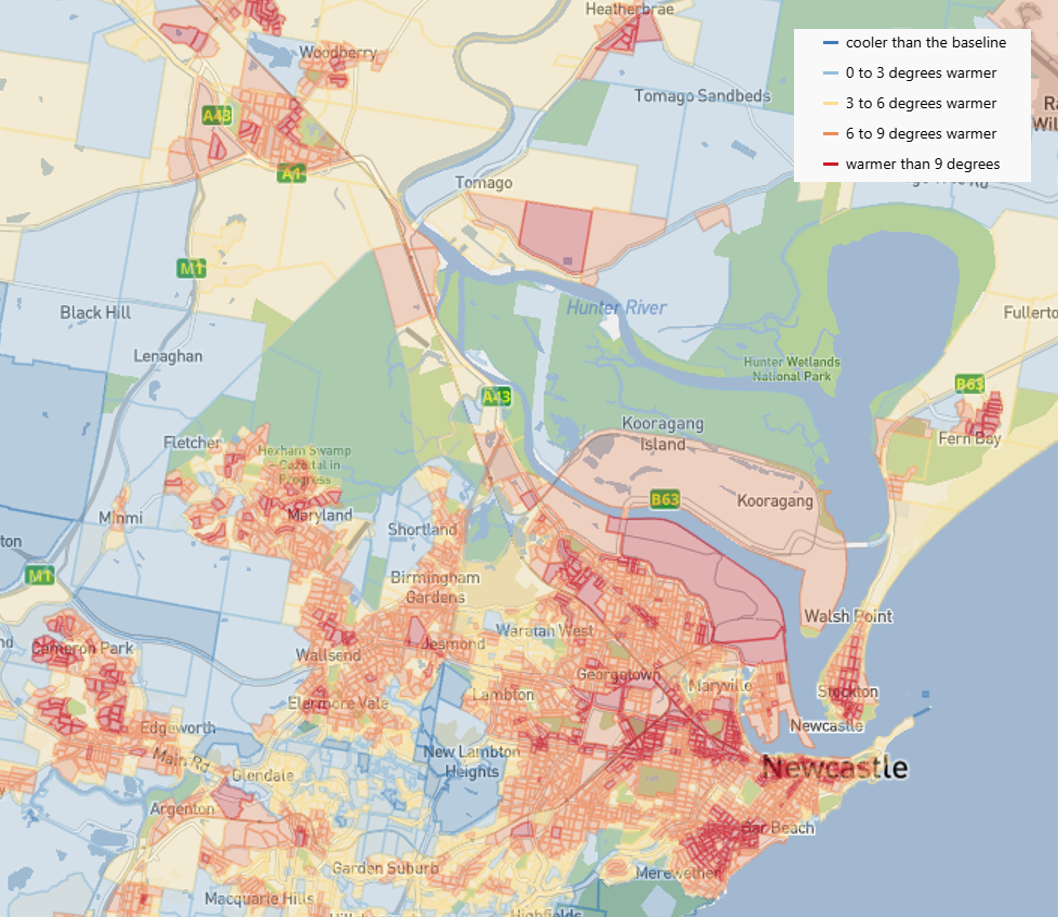
This evidence underpins the upcoming Blue Green Grid Action Plan, which connects parks, waterways, bushland, schools, town centers, and transport hubs through nature-based solutions. By identifying where green space gaps, heat vulnerability and access barriers coincide, the city can prioritize projects and communicate the rationale for these decisions.
Using maps to inform the public
In Makati, Philippines, mapping plays a central role in providing residents with accessible information and supporting inclusive city services.
Since 2004, all city departments have worked from a shared geographic information system, allowing spatial, demographic, and socioeconomic data to be integrated through a common platform. Initiatives such as the Makati Atlas, the Makati Address System, and the One Map, One Makati project provide standardized and real time geospatial information across government services.
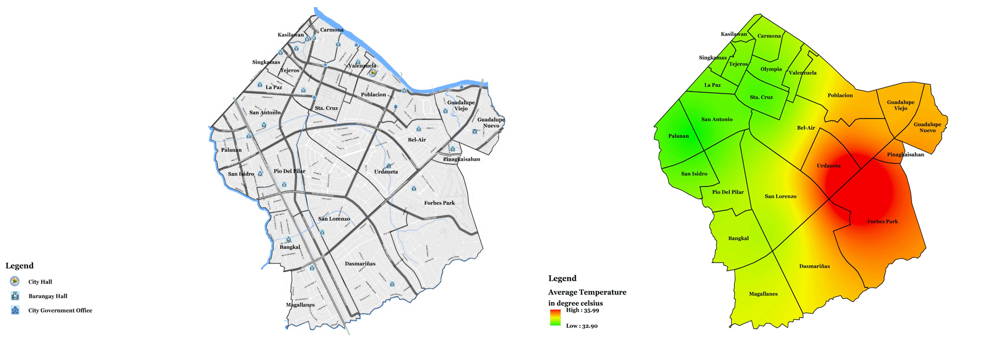
These tools help residents understand local conditions while enabling city officials to monitor access to public facilities, identify service gaps, prepare for disasters, and respond to climate related risks. They also highlight patterns such as uneven green space distribution, infrastructure pressures in densely populated areas, and differences in access to services.
Using maps to strengthen transparency
In Glasgow, U.K, mapping supports transparency and public accountability.
The city has embraced an open data approach through its participation in the Open Government Partnership, making data publicly available unless privacy concerns require otherwise. This includes extensive public health datasets that allow residents, researchers, and policymakers to better understand conditions across communities.
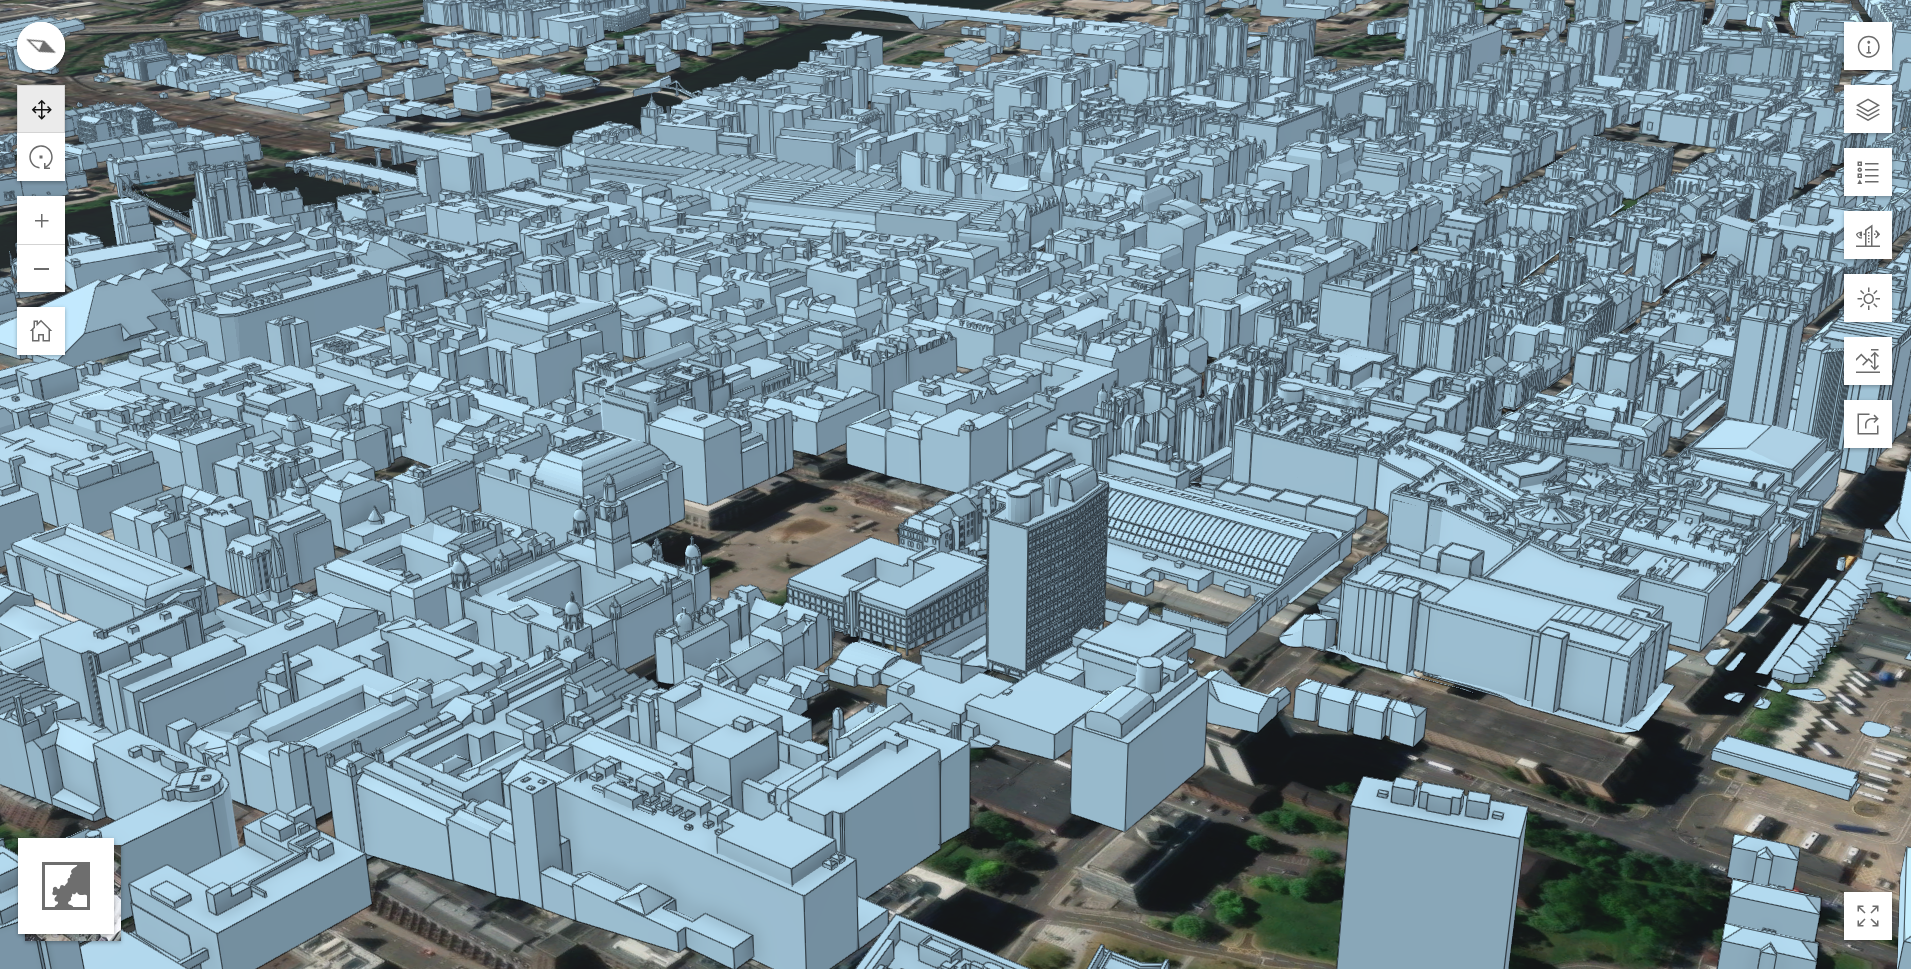
Mapping tools reveal persistent disparities in health, well being, life expectancy, and social capital, including inequalities affecting Black and minority ethnic communities. The Scottish Index of Multiple Deprivation provides further insight into how disadvantage is distributed geographically. Glasgow also uses innovative visualization tools such as the VU.CITY 3D city model and real time air pollution monitoring, which updates every fifteen minutes. These tools allow residents not only to access information but also to understand how planning decisions and environmental conditions affect their daily lives.
What can we learn from these cities?
While the contexts may differ, maps make inequality visible and demonstrate that place matters. They reveal patterns that may otherwise remain hidden within spreadsheets, reports, or administrative datasets. When multiple indicators point to the same neighborhoods, the case for action becomes much harder to ignore. By understanding where social, economic, and environmental challenges overlap, governments can target resources more effectively and design interventions that respond to local realities.
An additional important aspect is that maps can help to build trust. They provide a transparent way to explain why certain investments are prioritized, give residents access to information, and create a shared evidence base for public discussion.
What unites these cities is their commitment to using data not simply to describe problems, but to act on them. By turning geographic information into practical insight, they are creating stronger foundations for more equitable, resilient, and inclusive communities.
This article was developed as part of a Malmö Commitment peer exchange series around the ICLEI social equity framework and its key dimensions of access, participation and opportunity.


